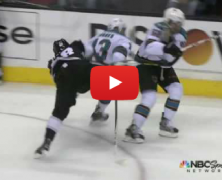
Todd’s Take: I’m all for player safety in hockey (along with the other sports) but where does the policing end? Hockey and football by nature, more so than every other spor,t are high intensity contact sports with violent collisions every game. Torres’ track record of cheap shots doesn’t bode well here or give him the benefit of the doubt from the league but unless you can determine intent, we have to let the best athletes in the world go about their business in the most intense of playoff...
Home Ice Disadvantage...
posted by Todd
It should come as no big surprise that road teams are having tremendous success so far through the first round of the 2012 NHL Playoffs (We highlighted 1st round trends back on 4/11). Through the first 32 games, teams playing on the highway are 21-11 netting bettors $1,519 assuming a base unit of $100. In an article published by ESPN back on April 9th, they rated the top 5 home ice advantages in all of hockey and those teams alone have combined to go 3-7 so it just goes to show that no one is safe in the confines of their own arena. Below you’ll find the breakdown of every game through the first 32 and while the results may surprise, it’s hard to argue with their early profitability. (All data courtesy of covers.com) Eastern Conference Western Conference Money Road Wins Money Road Wins Flyers/Penguins $342 3 Kings/Canucks $280 3 Senators/Rangers $41 2 Redwings/Predators $277 3 Capitals/Bruins $29 2 Blackhawks/Coyotes $261 3 Devils/Panthers $44 2 Blues/Sharks $245 3 Total $456 9 Total $1,063 12 Below you’ll find details by series with individual game results. Keep in mind this may be as much an anomaly as anything else so don’t forget the basics of handicapping in lieu of blindly betting road team’s moving forward. Road Team Result Price Road Team Result Price Game 1 Flyers W 167 Game 1 Kings W 142 Game 2 Flyers W 168 Game 2 Kings W 142 Game 3 Penguins L (100) Game 3 Canucks L (104) Game 4 Penguins W 107 Game 4 Canucks W 100 Total 3-1 342 Total 3-1 280 Road Team Result Price Road Team Result Price Game 1 Senators L (100) Game 1 Red Wings L (100) Game 2 Senators W 145 Game 2...
Round 1 Playoff Trends...
posted by Todd
Just because trends develop over time doesn’t mean they’re indicative of what the future may hold so handicap accordingly. However, below are 2 years of aggregated data from the 2010 and 2011 first rounds. Some of the results are coincidence, some are anomalies, and some paint a picture of what we can expect in this year’s round of 16. Don’t predicate any of your betting decisions on a single trend over a 2 year sample size of 98 games but keep in mind history can repeat itself and some of these numbers are hard to overlook. Series Betting The last 2 years, teams that win Game 1 in their first round playoff series are 7-9 so sometimes waiting to bet a series price can offer better value Western Conference teams who lost Game 1 were 4-0 for the series in 2011 while they were 0-4 in 2010. The East hasn’t quite been the same wild ride as last year the loser of Game 1 went 1-3 compared to 2-2 in 2010. Road Warriors When searching for live dogs, take a look at teams playing on the highway to offer solid value. The normal home/road adjustment is between .50 to .60 cents despite road teams compiling a winning record over the last 2 years. 2010: Road teams were 27-22 (13-11 in the Eastern Conference and 14-11 in the Western Conference) 2011: Road teams were 24-25 (12-14 in the Eastern Conference and 12-11 in the Western Conference) One Goal Decisions Those looking to take the “juicy” puckline odds on favorites need to keep in mind that 1 goal outcomes abound so there’s a reason teams laying 1.5 are often +200 and dogs carry tags of -200 or more. 2010: 22 of 49 (45%) 1st round games were...
Race for the chase: Western Conference...
posted by Todd
Team PTS GR Home Away Remaining Schedule Chicago 93 5 2 3 Stl, @Nas, Min, @Min, @Det San Jose 88 6 2 4 @Ana, @ Phx, Dal, @Dal, @Lak, Lak Dallas 87 6 2 4 @Edm, @Van, @SJ, SJ, @Nas, Stl Phoenix 87 5 3 2 SJ, Ana, Clb, @Stl, @Min Los Angeles 86 6 2 4 @Cal, @Edm, @Min, Edm, SJ, @SJ Colorado 86 4 2 2 @Van, @Cal, Clb, Nas Calgary 85 5 4 1 Lak, Col, @Van, Van, Ana Peej’s Pucks (follow him on twitter @peej___ ) Going into tonight’s action, here are the up to the minute standings in the Western conference where 7 teams are competing for 4 playoff spots (closer to 6 for 3 as the only way the Blackhawks fall out of the picture is with an epic late season collapse). Chicago It will be interesting to see how the Hawks adjust to life without Toews and Keith. Grabbing points in 6 of their last 7 has virtually put them in the playoffs. The upcoming home and home with the Wild will certainly go a long way in securing their 6th spot in the standings. Why is finishing 6th so important in the conference? Whoever falls here will take on the champion of the Pacific division, the closest thing the NHL has to a season long grease fire. San Jose While currently in the 3rd spot after their win Monday night over Colorado and leading the Pacific division, the Sharks tenuous hold could change by the minute. With 4 of the 5 teams in the Pacific division within 2 points of each other it’s anyone’s guess as to who comes out on top of the division. The Sharks are on a 6 – 3 – 1...
Race for the chase: NHL’s Eastern Conference...
posted by Todd
Team PTS GR Home Away Remaining Schedule New Jersey 90 6 4 2 Chi, TB, @Car, NYI, @Det, Ott Ottawa 88 5 2 3 @Phi, @NYI, Car, Bos, @NJ Washington 84 6 3 3 Buf, @Bos, Mon, @TB, Fla, @NYR Buffalo 84 6 2 4 @Was, Pit, @Tor, Tor, @Phi, @Bos Winnipeg 78 6 2 4 NYR, @Car, @TB, @Fla, @NYI, TB Peej’s Pucks (Follow him on twitter @peej___ ) Going into Tuesday night’s action, here are the up to the minute standings in the Eastern conference: 5 teams competing for 3 playoff spots and here’s the breakdown as we approach crunch time of the NHL season. New Jersey NJ will have to find a way to put the puck in the net if they plan to make any noise in the playoffs. However, their 4 pt edge with 4 home games remaining (20 – 13 – 4 at home) has me believing they’ll get into the postseason. The biggest remaining question is who their opponent will be in the first round but unless the neutral zone trap comes back into fashion or Marty Brodeur finds the fountain of youth, this team can’t make a deep run. Ottawa The Sens are definitely in a battle for the postseason with 3 out of their final 5 games away from the nations capital (18 – 13 – 6 away) Before back to back impressive wins over the beast in the east Pittsburgh and Winnipeg on the highway, the Senators playoff hopes were on life support. If they can find a way to carry this momentum into their final stretch coupled with a healthy Craig Anderson between the pipes, don’t count them out as a sleeper on the bottom half of the draw. Washington If the caps...
Rollover Effect: The Redwings home win streak...
posted by Todd
The Detroit Redwings are on an unprecedented home ice winning streak. When you win 23 straight games in your own building, bettors catch on and reap the benefits. Below you’ll find a breakdown of the exact earning potential had you been aboard the wave and started with a $100 bet. Of course keep in mind books aren’t taking high 5 figure bets on hockey but what’s the point of reality getting in the way of a good story? DETROIT RED WINGS 23 GAME HOME WIN STREAK Bet Amount Opponent Spread Win Amount $100 Anaheim -147 $68 $168 Colorado -161 $104 $272 Edmonton -165 $165 $437 Dallas -172 $254 $691 Calgary -169 $408 $1,099 Nashville -132 $832 $1,931 Tampa Bay -180 $1,072 $3,003 Phoenix -156 $1,925 $4,928 Winnipeg -224 $2,200 $7,128 Los Angeles -173 $4,120 $11,248 St. Louis -166 $6,771 $18,019 St. Louis -152 $11,853 $29,872 Phoenix -183 $16,310 $46,182 Chicago -145 $31,847 $78,029 Buffalo -250 $31,212 $109,241 Columbus -318 $34,351 $143,592 St. Louis -140 $102,525 $246,117 Edmonton -224 $109,867 $355,984 Anaheim -169 $210,386 $566,370 Philadelphia -163 $347,185 $913,555 Dallas -207 $441,247 $1,354,802 Nashville -142 $1,002,553 $2,357,355 San Jose -150 $1,569,998 TOTAL VALUE AFTER 23 GAMES...
Power Up: NHL midseason report...
posted by Todd
By @Peej__ As we hit the unofficial hockey mid-season mark, there’s still plenty of jockeying left to be done for 16 post season births. Here’s how we see the chase for Lord Stanley playing out the rest of the way 30: Columbus Blue Jackets One word to describe them: DREADFUL – On the bright side the Buckeyes are only 218 days away from the start of their season and the beginning of the Urban Era. At least there will be talent on the ice next year wearing home sweaters…in the 2013 All-Star game 29: Carolina Hurricanes They’re only 10 pts out of a playoff spot but having to jump 7 teams to get into the tournament is absolutely unheard of in the NHL. Carolina’s biggest problem? Only one player on the roster has compiled more than 30 pts this year. 28: Edmonton Oilers The young talent in Edmonton is starting to bloom and the PP is among the league’s best. The problem? Youth will hold them back until this team gets more seasoning and veteran leadership. The future looks bright for the Oilers, it just won’t be realized in 2012. 27: Tampa Bay Lightning All the talent to make a run for the playoffs with the league’s premier goal scorer in Steven Stamkos however something seems to be lacking in Tampa this year – desire? Maybe, but a league worst 165 goals allowed is more to blame for their current place in the standings 26: Montreal Canadiens If they expect to make the playoffs they will have to stiffen up at home. Montreal’s goal differential of -4 says they’re capable of making a run if they get timely scoring and get a few bounces the 2nd half of the year although I think they’ll...

