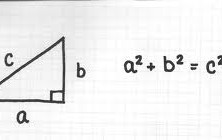
In the 1980s, sports analytics pioneer Bill James developed a formula to calculate an expected winning percentage for a MLB team based on its’ runs scored and runs allowed. The equation, named after its resemblance to trigonometry’s Pythagorean Theorem, is fairly simple: Written by Justin Zovas (follow him on twitter @JustinZovas) The formula computes how many games a team should have won based on its runs scored and allowed. James found that a team’s scoring margin is highly correlated with its winning percentage. Teams whose actual wins exceeded their Pythagorean wins are considered ‘lucky’ and teams that underperformed relative to their Pythagorean expectation are considered ‘unlucky’. For those of us concerned with predicting future outcomes, the main takeaway is that Pythagorean win percentage is superior to actual winning percentage in determining a team’s future winning percentage. Over the years, the formula has been slightly altered by statisticians and refined for NFL analysis (2.37 is the exponent commonly used for football). Although the sample size is dramatically reduced, evidence supports that NFL teams that overachieve or underachieve relative to their expected Pythagorean win expectation are subject to regression the following season. Inspired by Joe Peta’s work with “Cluster Luck” in baseball as described in his book Trading Bases: A Story About Wall Street, Gambling, and Baseball, I have taken this type of analysis a step further and created a second-order Pythagorean win expectation for NFL teams. My goal is to answer the following question: Based on a team’s performance statistics, what should have been its net scoring differential and then, ultimately, its ‘adjusted’ Pythagorean win percentage? The reasoning is that the influence of randomness is not limited to just wins and losses. A number of bounces—of both good and bad fortune—over the course of a...
Props Fix
posted by Todd
Credit is owed to William Hill US for taking initiative and creating a handful of unique prop markets. Headed to Vegas this weekend? Try your hand and betting acumen at a few new creative offerings. COLLEGE BASKETBALL Number of Big Ten teams to make the 2013 Final Four 0: 11/5 1: +130 (bet $1 to win $1.30) 2: 11/5 3: 10/1 4: 250/1 Will a Big 12 team make the 2013 Final Four? Yes: -130 (bet $1.30 to win $1) No: +110 Will a Pac-12 team make the 2013 Final Four? Yes: +250 No: -300 Will a Mountain West team make the 2013 Final Four? Yes: +650 No: -850 COLLEGE FOOTBALL Who will have more regular season wins in the 2013-14 season? San Francisco 49ers: +120 Alabama Crimson Tide: -140 Will an SEC team win the 2013-14 BCS championship? Yes: -200 No:...
Prop Fix
posted by Todd
Written by Justin Zovas The market has hammered the side and total lines into place for well over a week now and most, if not all, of the value has been sucked out of these numbers. Thankfully for us bettors and NFL enthusiasts alike, the Super Bowl presents a multitude of diverse options to wager on. Here are three propositions I like this Sunday. Ray Lewis solo + assisted tackles o/u 11.5. Pick: Under 11.5 (-110) Reasoning: In his career, Ray Lewis has averaged 9.1 combined solo + assisted tackles per game. At 9.5 tackles per game this season, his 2012 numbers have remained consistent with his career. In his past three postseason games, however, Lewis has produced the following tackle numbers; 13, 17, 14. Parlay these recent three straight above average performances with the appeal for the average bettor to bet overs, and the result is line inflation. Replace Ray Lewis’ name with random linebacker X, and this number is right around 9 where it should be. First team to make a field goal. Pick: 49ers convert a field goal first (-110) Reasoning: Put simply, the 49ers offense loves to settle for field goals and the Ravens defense thrives at forcing its opponent into field goal attempts. David Akers led the league with 42 field goal attempts this season. Meanwhile, the Ravens allowed the most field goals in the league this year with 37. Also consider that the Ravens boast one of the stingiest red zone defense’s in the league, surrendering a runner-up 42.86% red zone touchdown percentage in 2012. Lastly, thanks to the Ravens recent trend of choosing to kick off to start the game, oddsmakers believe that the 49ers are most likely to receive the ball first (prop is currently at-150,...
Divisional Revenge: Something Worth Considering...
posted by Todd
Written by Justin Zovas This weekend’s slate of divisional games presents three of four matchups where the two teams are meeting for a second time this season. With that, here is a powerful trend that favors the team that lost the regular season contest: Since 2002, when two teams are meeting for the second time (or even the third) that season in the playoffs, the team that lost the previous matchup is 44-26-1 (.629) ATS. Of course, trends are only as valuable as the rationale that supports them. This trend can be explained logically by understanding three angles: Motivation: The team that lost the regular season matchup may be the more motivated squad. The incentive for revenge is a very influential factor on the outcome in sports or any competition for that matter. At the same time, the team that was victorious earlier in the year may take its opponent lightly. The team still wants to win, but it may prepare with less vigor and not with enough focus. Any slight motivational edge in a league with such parity can result in a significant difference between the projected and actual final score of NFL games. Market Overreaction: We as humans are heavily influenced by what has happened most recently. This phenomenon, known as recency bias, captures the idea that the most recent events, patterns, and trends dominate our predictions of future outcomes. With public sentiment more prevalent than ever in this playoff market, bettors tend to overact to past results and expect them to continue into the future. This market overreaction diminishes the value on the team that won the regular season game and creates line value for the team that lost the first matchup Coaching Adjustments: Because the teams are meeting for the...
Anatomy of a Champion...
posted by Todd
Written by Justin Zovas 32,882 plays, 256 games, and 17 weeks later, the field to determine the 2013 Super Bowl Champion has been dwindled down to 12 teams. The past four months of NFL action has produced a sample size of data that, when analyzed appropriately, can provide a wealth of information and go a long way in evaluating the strength and abilities of the remaining teams vying for a championship. An effective method to predict future outcomes is to study past results of similar situations. Thus, the goal is to better understand the anatomy of a Super Bowl champion by identifying meaningful shared statistical characteristics of those teams. In this new age NFL where quarterback play and the passing game is as important as ever, here are three key statistical parameters each of the past four champs fall under. Pass Efficiency Ratio greater than 1.20: The ratio compares net yards per passing attempt and net yards per passing attempt allowed (NY/PA divided by NY/PA allowed). A ratio equal to one indicates for every one yard an offense gains per pass attempt, the defense allowed one yard per pass attempt. In today’s aerial league, this performance measure captures arguably the two most important team qualities; the ability to pass the football and the ability to stop the pass. This season only three teams, the Broncos, 49ers, and Seahawks, boast a pass efficiency ratio greater than 1.20. Positive Turnover Margin: This statistic is the total number of forced turnovers minus the total number of turnovers committed. The ability to take care of the football and force the opposing offense into turnovers remains a crucial determinate in the outcome of football games. In 2012 alone, the team that won the turnover battle is 162-42-1 (.794) SU...
Mush McGee Week 8
posted by Todd
Mush Mcgee Week 8 Picks (by Keith Ellett) Everybody thank Todd for finally posting my picks to his blog. If I were you, I would start looking for a new bookie because yours is sure to cut you off if I continue to share my weekly gems. For those that don’t know me, my name is Mush McGee. I get most of my knowledge from watching endless hours of ESPN and I think Chris Berman is the ubber sharp. Most of my personal numbers are congruent to ESPN’s power rankings because if they do it professionally, why should I craft my own? Using those numbers, I consistently dominate NFL sides and totals. I only post my strongest plays and I give a suggested unit size for each play. I like to play the biggest games of the week, especially the Sunday and Monday Night games since they’re the softest lines of the week making them the easiest to cap and provide the biggest edge. As I expected, this past Thursday night game was as exciting as getting kicked in the groin. That left me a perfect opportunity to head over to surf the net and do some much needed research. I also listened to Mike and Mike all week, meaning I’m up to date on which teams are great and which teams are better off not showing up this Sunday. There are a few obvious locks in the morning session for today… Let’s start with San Diego Chargers -3 at Cleveland Browns. The Browns really are one of the worst teams in the league this year, or every year for that matter. San Diego is coming off a bye and they will be desperate to prove themselves after the collapse a few weeks ago...
Airing it Out
posted by Todd
Written by Justin Zovas (follow him on twitter Justin_Zovas) It comes as a surprise to no one that the NFL has become a passing league. In 2008, teams passed on 55.56% of plays. In 2009, teams threw the football 56.39% of the time, 57.01% in 2010, and 57.22% in 2011. Anyone else seeing a trend developing here? The prevalence of passing in the NFL has consistently risen since 2008 with each season breaking the record set during the prior season. Last season alone, we witnessed three different quarterbacks throw for over 5,000 yards, a feat that had only occurred twice before in NFL history. Thanks to a combination of rule changes to promote player safety, defensive secondaries struggle to sustain a level of performance that has been established in the past. As a result, the NFL has evolved into an aerial league and the quarterback position is now more important than ever. The consensus elite QB’s; Aaron Rodgers, Tom Brady, and Drew Brees are a combined 200-141-7 (58.7%) ATS as starters with their respective teams’. This stat isn’t meant to suggest automatically going out and betting these guys blindly, (past success does not ensure future value; efficient market theory) but rather serves to illustrate how powerful an effect elite quarterbacks can have on the outcome of games (with all due respect to Trent Dilfer and the game managers of yesteryear). Handicapping the quarterback position and a defenses’ ability to stop a passing attack is paramount in order to successfully predict the final score of NFL games. I calculated an efficiency ratio to quantify my hypothesis. The ratio compares net yards per passing attempt and net yards per passing attempt allowed (NY/PA divided by NY/PA allowed). A ratio equal to one indicates for every one...
Utilizing the Tease
posted by Todd
Written by Justin Zovas “Teasing” the point spread in the NFL has always been an appealing wager for bettors. “You mean I can move the line in my favor? Easy money!” Yes, teasing the point spread appears attractive on paper but there is a reason sports books welcome teaser action when priced accordingly: the book is winning the majority of the time because bettors aim to tease favorites down under the assumption “Team A can’t lose.” Take your standard six point teaser for example: If every game since 1989 was teased six points in a team’s favor, the overall ATS record would be 7728-3490-218 (68.9%). Again, teasing an individual line looks good however a teaser requires both legs to win. In order to break even in a teaser, both legs must hit at 72.4% (.724^2 = .524.) Once you take this into consideration, suddenly teasing isn’t so appealing if done incorrectly. Here are some simple steps to determine your return on investment if every game since 1989 was teased: 1. Divide the amount of wins by the total amount of games observed ( wins, losses, and pushes); 7728/11,436=.6757… This gives you the win percentage of each individual teased game. 2. Square the win percentage because both legs must win in order for a teaser to cash; .6757…^2 = .456… This gives you the success rate of the wager. 3. Based on -110 odds for a 6 pt teaser, you are winning $10 45.6% of the time and losing $11 54.4% of the time; (.45666)*(10) – [(1-.45666)*(11)] = -1.41 4. Divide your expected value by the amount you risked to find your return on investment;-1.41/11 = -12.82% The expected value for teasers may be in the red but all hope isn’t lost for teasing NFL...
Extra Rest Means Extra Offense...
posted by Todd
Written by Justin Zovas In our last installment we took a look at how NFL teams responded on a short week so it only seemed logical to jump to the opposite end of the spectrum and analyze the impact an extended period of time between games has ATS and O/U results. The bye week creates a situation where one would hypothesize that better coaches should excel. Let’s not kid ourselves, playing on teams coming off a bye is has become a trendy thing for bettors. However, historical data disproves this theory. Since 1989, teams coming off a bye are only a 50% proposition (363-341-13). For every team that comes out sharp and re-energized after the bye, another team will come out sluggish and rusty. Each coach handles the bye week differently: some allow for players to take a full vacation away from football while others have their players in meetings studying game film Tuesday morning. Whatever the approach, historical data doesn’t lie. Below is a chart highlighting four current coaches who have flourished off their bye week at a combined mark of 25-3 ATS. Coach Current Team ATS Record ATS Margin SU Record SU Margin Andy Reid Eagles 11-3 +8.5 14-0 +12.7 Mike McCarthy Packers 6-0 +10.6 5-1 +12.3 John Harbaugh Ravens 4-0 +13.2 4-0 +18 Chan Gailey Bills 4-0 +19 3-1 +20.5 Teams coming off a Thursday night contest presents another scenario where the time between games is longer than a week. Albeit only a few extra days, this extended break between games has offered a few interesting trends of its own. Since 1989, teams coming off a Thursday night game are 115-102-3 ATS (a modest 53.0%) the following week. However, the over in these games is 126-89-5 (58.6%). When the team with extra rest is...
Tackling Thursday NFL...
posted by Todd
Written by Justin Zovas This past February, amidst the media frenzy that is Super Bowl week, NFL commissioner Roger Goodell revealed a schedule change that made gamblers and fans alike rejoice. The upcoming 2012 football season will feature an increase in Thursday night football games which of course creates another stand alone football betting opportunity. In addition to the previously abbreviated Thursday options, NFL network will be airing Thursday night football games beginning in week 2. With the new schedule make-up, every team will be given the opportunity to showcase their talents (or lack thereof) under the lights in front of a national audience. More prime-time football will obviously makes gamblers happy because they’ll find an edge to exploit the shortened week. There is a reason NFL games are only played once a week and it boils down to the rigorous demands of the sport. Asking a team to play on just three days’ rest is a demanding task given the normal recovery from both the mental and physical side. The quick turnaround makes it difficult for players to rebound from their previous game and get adequate time for treatments and preparation. Toss nagging injuries and long distance travel into the equation and suddenly the road weary side faces a rather steep challenge when facing superior competition. With these factors in mind, here are some Thursday night trends to be aware of heading into the 2012 season: Home teams on Thursday nights after both teams played the previous Sunday are 55-40-2 ATS since 1989. When the home team is also favored under the same conditions, the favorite is 37-18-2 ATS. That means betting Thursday night home favorites has been successful 67.3% of the time and from my vantage point the logic here is relatively simple: Not...
April 11 with 3HL 104.5 the Zone – Nashville...
posted by Todd
Click here to listen Talking ongoing NHL futures adjustments, Week 1 NFL lines, and TV superstardom for the 3HL reality tour.
22 Years of Superbowl data...
posted by Todd
Here are the statewide figures for the last 22 years of Superbowl data. Each chart is sorted and filtered from high to low in regards to handle, win, and of course hold %. Year Handle Win Hold 2006 94,534,372 8,828,432 9.34% 2012 93,899,840 5,064,470 5.39% 2007 93,067,358 12,930,175 13.89% 2008 92,055,833 -2,573,103 -2.80% 2005 90,759,236 15,430,138 17.00% 2011 87,491,098 724,176 0.83% 2010 82,726,367 6,857,101 8.29% 2009 81,514,748 6,678,044 8.19% 2004 81,242,191 12,440,698 15.31% 1998 77,253,246 472,033 0.61% 1999 75,986,520 2,906,601 3.83% 2003 71,693,032 5,264,963 7.34% 2002 71,513,304 2,331,607 3.26% 2000 71,046,751 4,237,978 5.97% 1996 70,907,801 7,126,145 10.05% 1997 70,853,211 2,265,701 3.20% 1995 69,591,818 -396,674 -0.57% 2001 67,661,425 11,002,636 16.26% 1993 56,811,405 7,174,869 12.63% 1994 54,483,221 7,481,541 13.73% 1992 50,334,277 301,280 0.60% 1991 40,080,409 3,512,241 8.76% Year Handle Win Hold 2005 90,759,236 15,430,138 17.00% 2007 93,067,358 12,930,175 13.89% 2004 81,242,191 12,440,698 15.31% 2001 67,661,425 11,002,636 16.26% 2006 94,534,372 8,828,432 9.34% 1994 54,483,221 7,481,541 13.73% 1993 56,811,405 7,174,869 12.63% 1996 70,907,801 7,126,145 10.05% 2010 82,726,367 6,857,101 8.29% 2009 81,514,748 6,678,044 8.19% 2003 71,693,032 5,264,963 7.34% 2012 93,899,840 5,064,470 5.39% 2000 71,046,751 4,237,978 5.97% 1991 40,080,409 3,512,241 8.76% 1999 75,986,520 2,906,601 3.83% 2002 71,513,304 2,331,607 3.26% 1997 70,853,211 2,265,701 3.20% 2011 87,491,098 724,176 0.83% 1998 77,253,246 472,033 0.61% 1992 50,334,277 301,280 0.60% 1995 69,591,818 -396,674 -0.57% 2008 92,055,833 -2,573,103 -2.80% Year Handle Win Hold 2005 90,759,236 15,430,138 17.00% 2001 67,661,425 11,002,636 16.26% 2004 81,242,191 12,440,698 15.31% 2007 93,067,358 12,930,175 13.89% 1994 54,483,221 7,481,541 13.73% 1993 56,811,405 7,174,869 12.63% 1996 70,907,801 7,126,145 10.05% 2006 94,534,372 8,828,432 9.34% 1991 40,080,409 3,512,241 8.76% 2010 82,726,367 6,857,101 8.29% 2009 81,514,748 6,678,044 8.19% 2003 71,693,032 5,264,963 7.34% 2000 71,046,751 4,237,978 5.97% 2012 93,899,840 5,064,470 5.39% 1999 75,986,520 2,906,601 3.83% 2002 71,513,304 2,331,607 3.26% 1997 70,853,211 2,265,701 3.20% 2011 87,491,098 724,176 0.83%...

